1. RFM Analysis Concept Overview
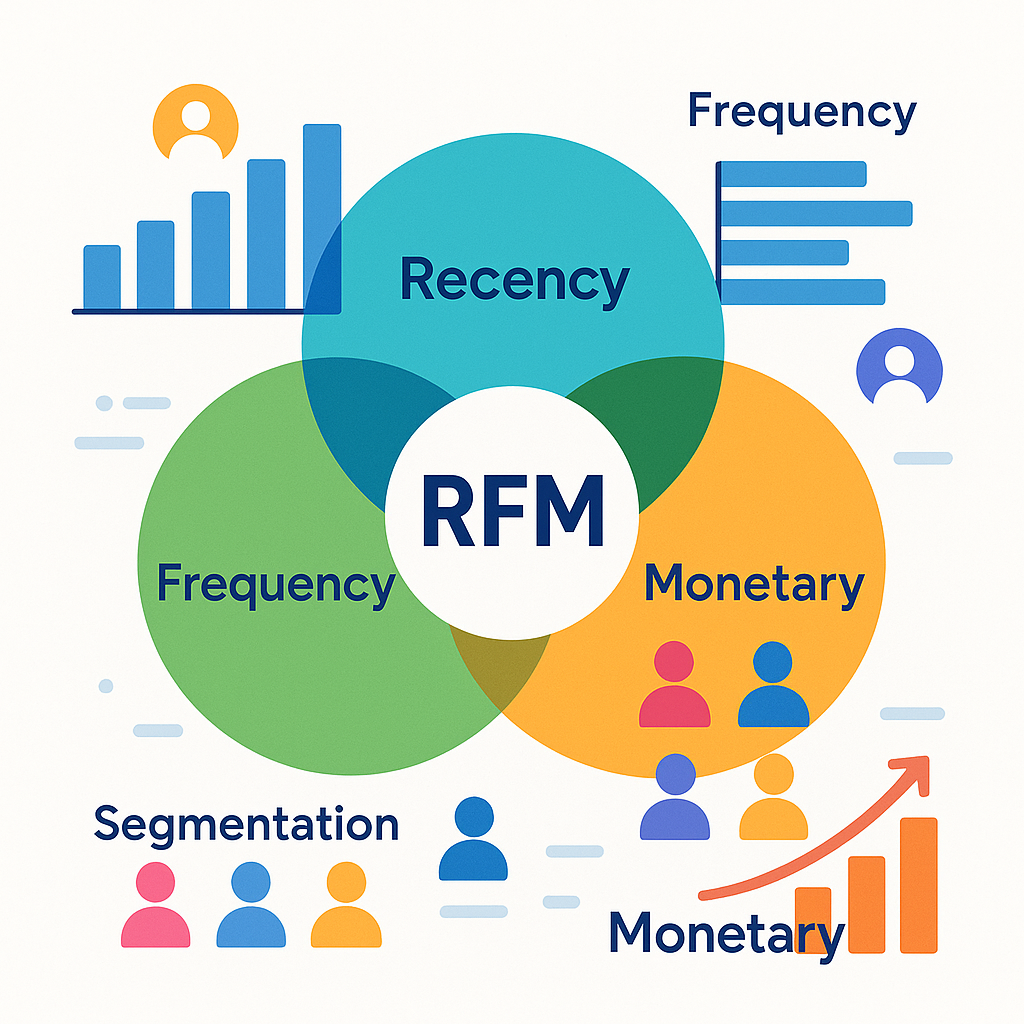
This foundational image illustrates the three core components of RFM analysis (Recency, Frequency, Monetary) with interconnected visual elements and data visualization charts. Perfect for introducing the RFM concept in your blog introduction.Advanced implementations expand beyond purchase data to include website behavior, social media engagement, customer service interactions, and cross-channel touchpoints for comprehensive customer understanding
2. Customer Segmentation Pyramid
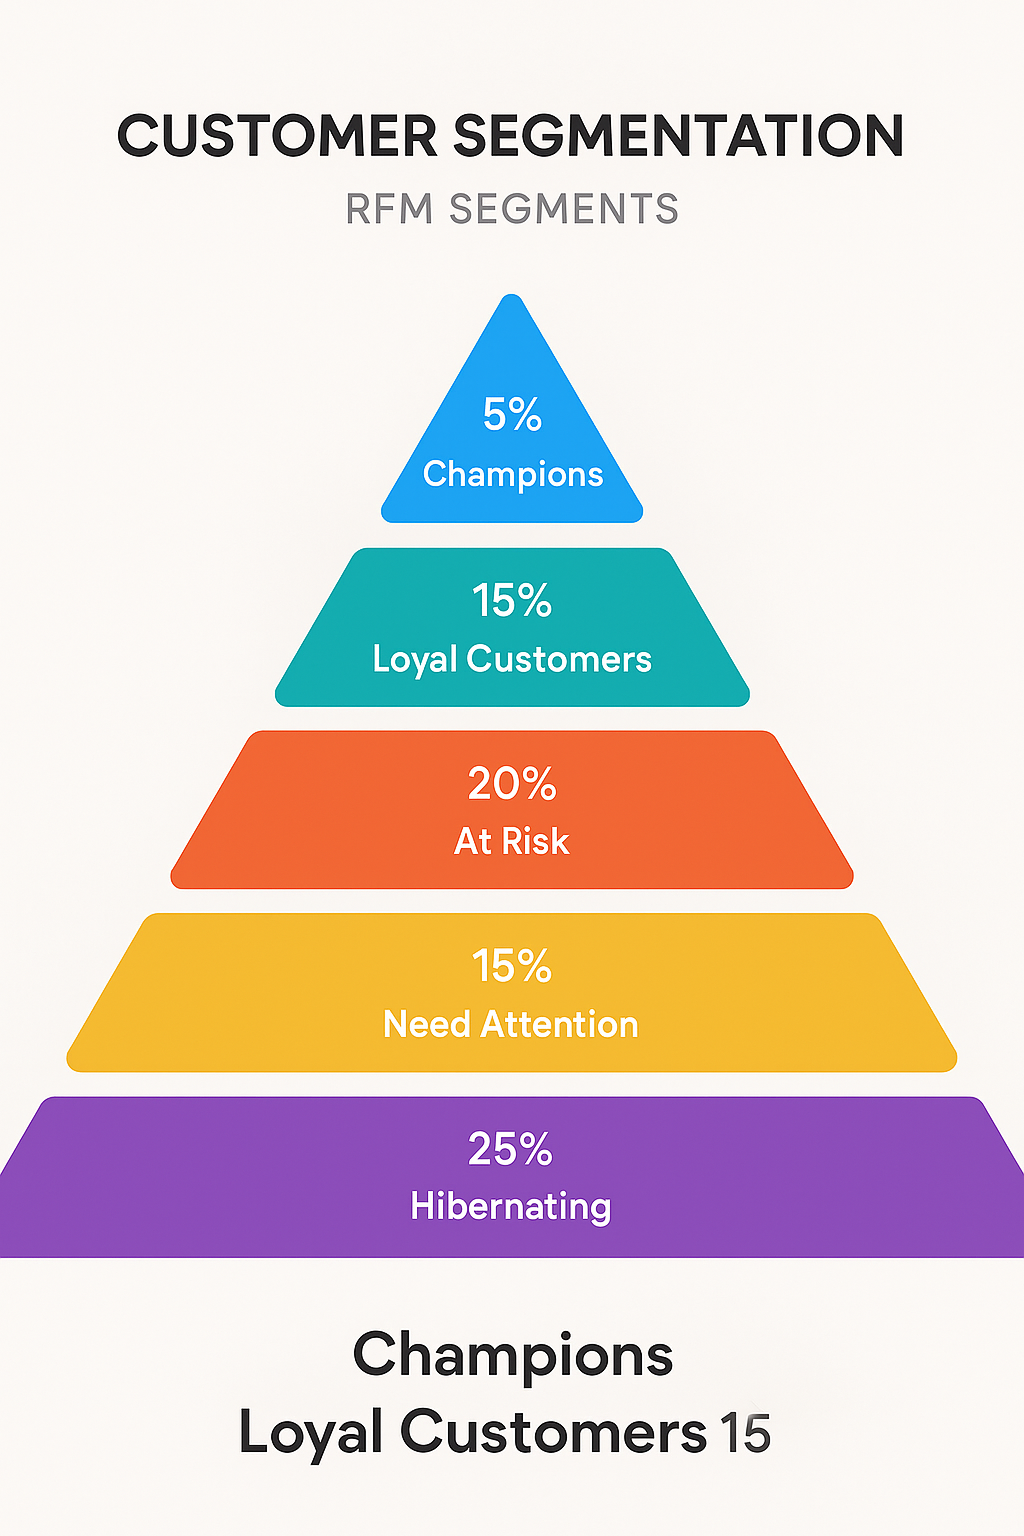
A comprehensive pyramid diagram showcasing different RFM customer segments like Champions, Loyal Customers, and At Risk customers with color-coded sections and percentages. Ideal for explaining the various customer categories and their relative importance.
3. RFM Implementation Workflow
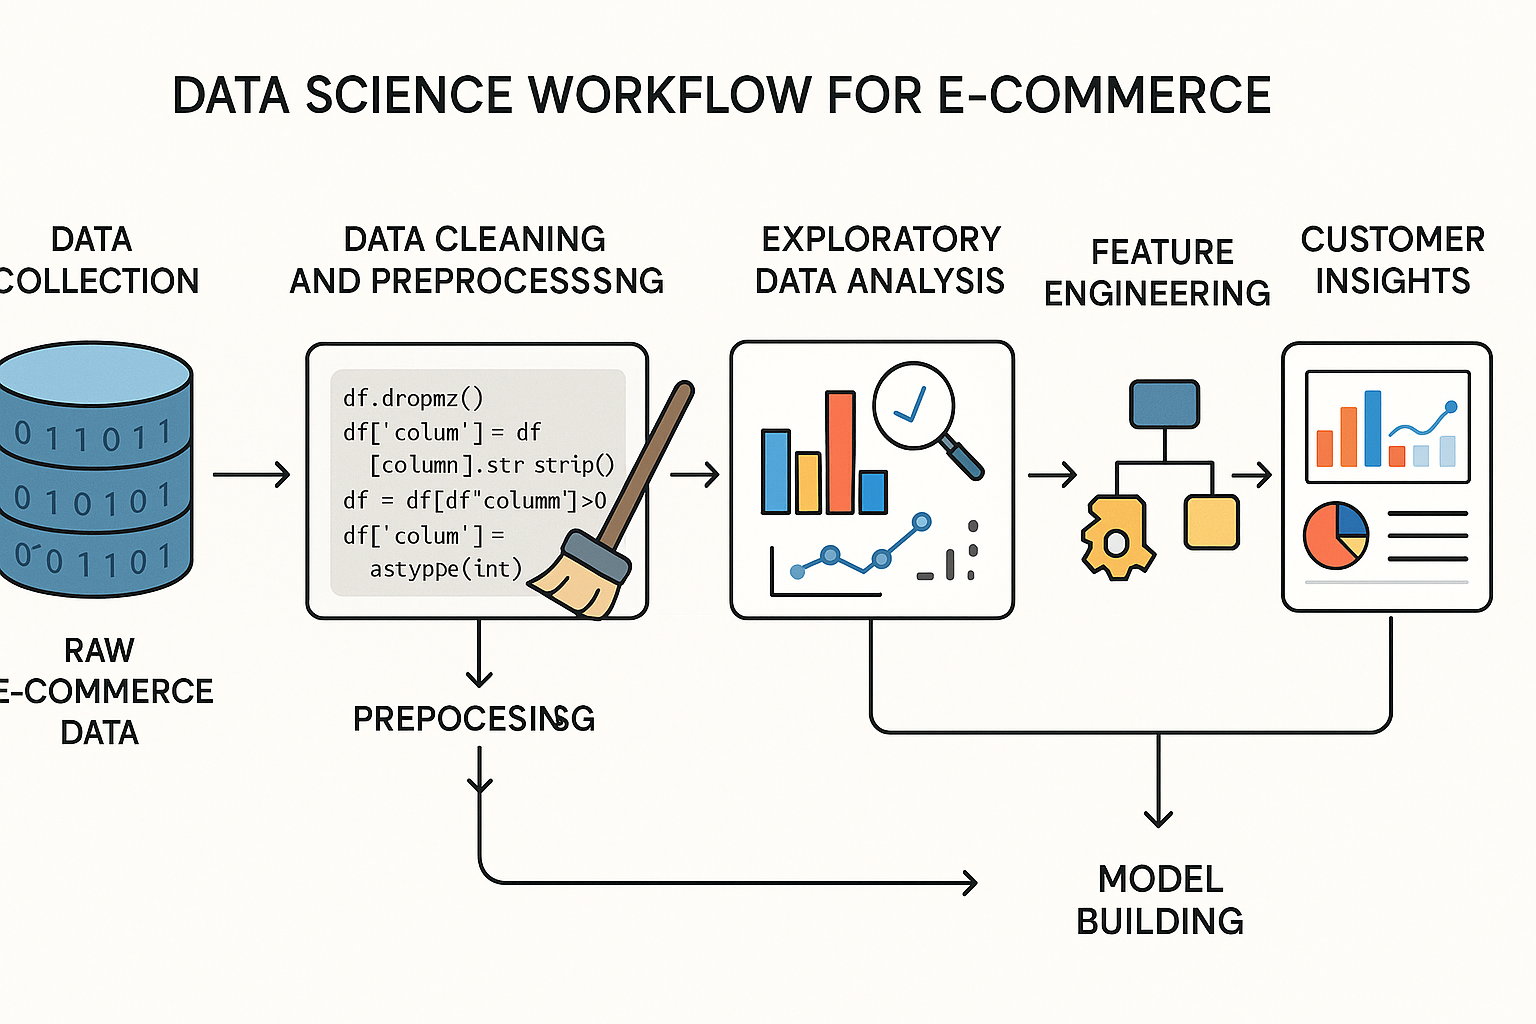
A detailed data science workflow illustration showing the step-by-step process from raw e-commerce data to actionable customer insights, including Python code elements and analytics dashboards. Perfect for the technical implementation section.
4. Marketing Strategy Infographic
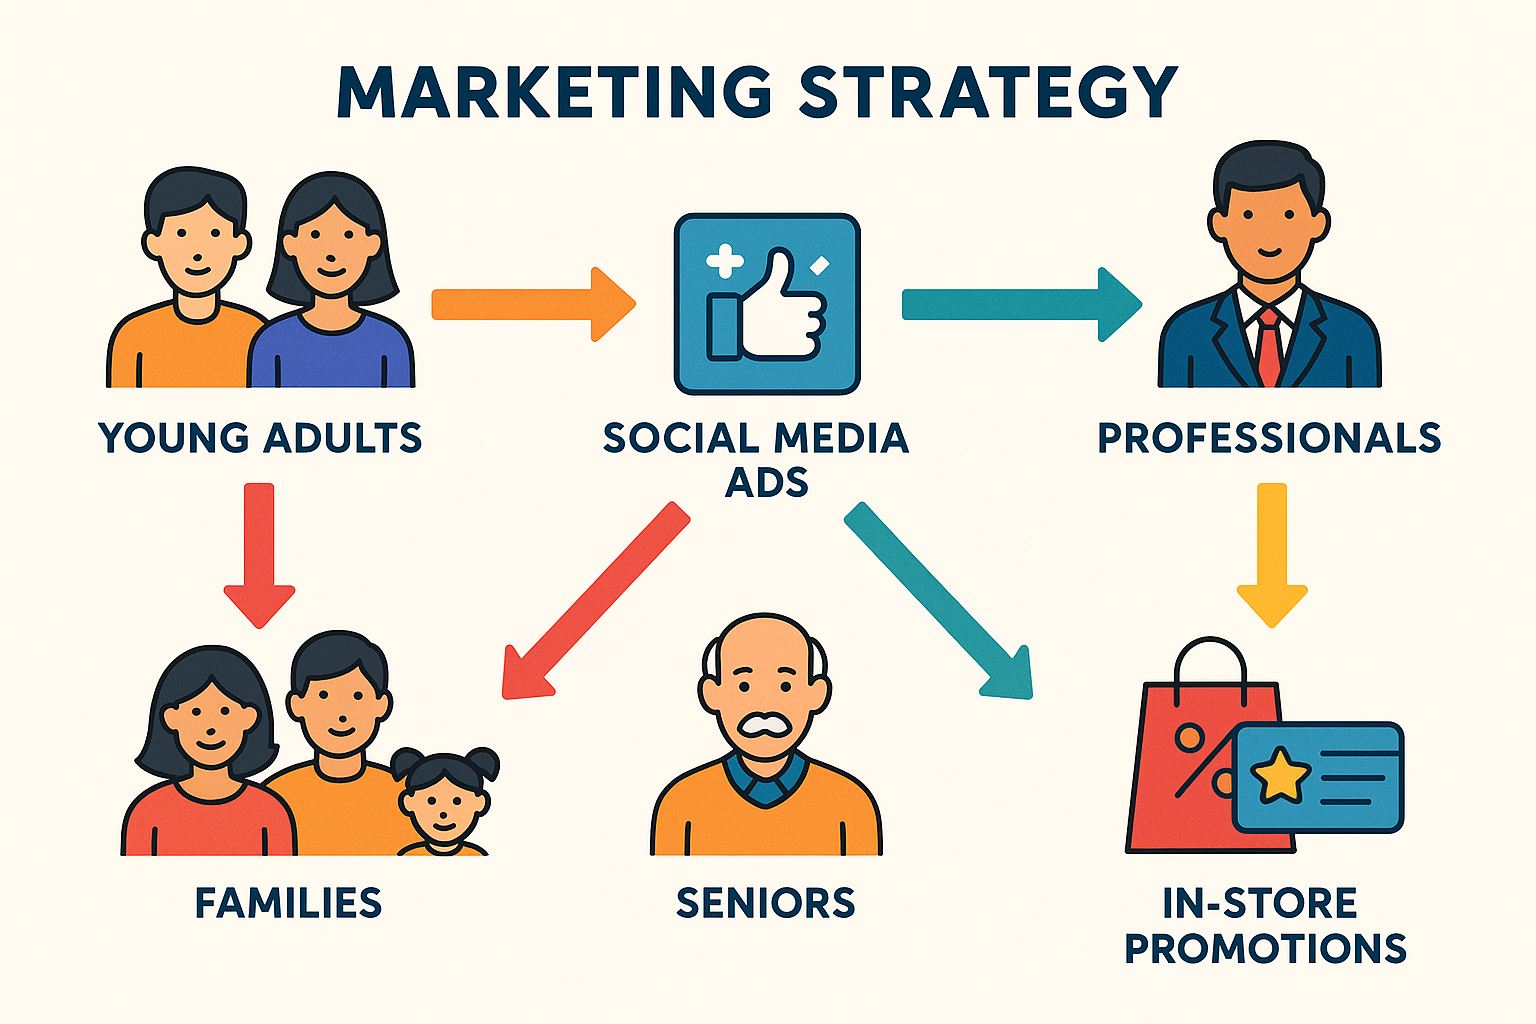
An engaging infographic displaying targeted marketing campaigns and engagement tactics for different RFM customer segments with arrows, icons, and strategic elements. Great for illustrating practical applications.
5. ROI Impact Dashboard
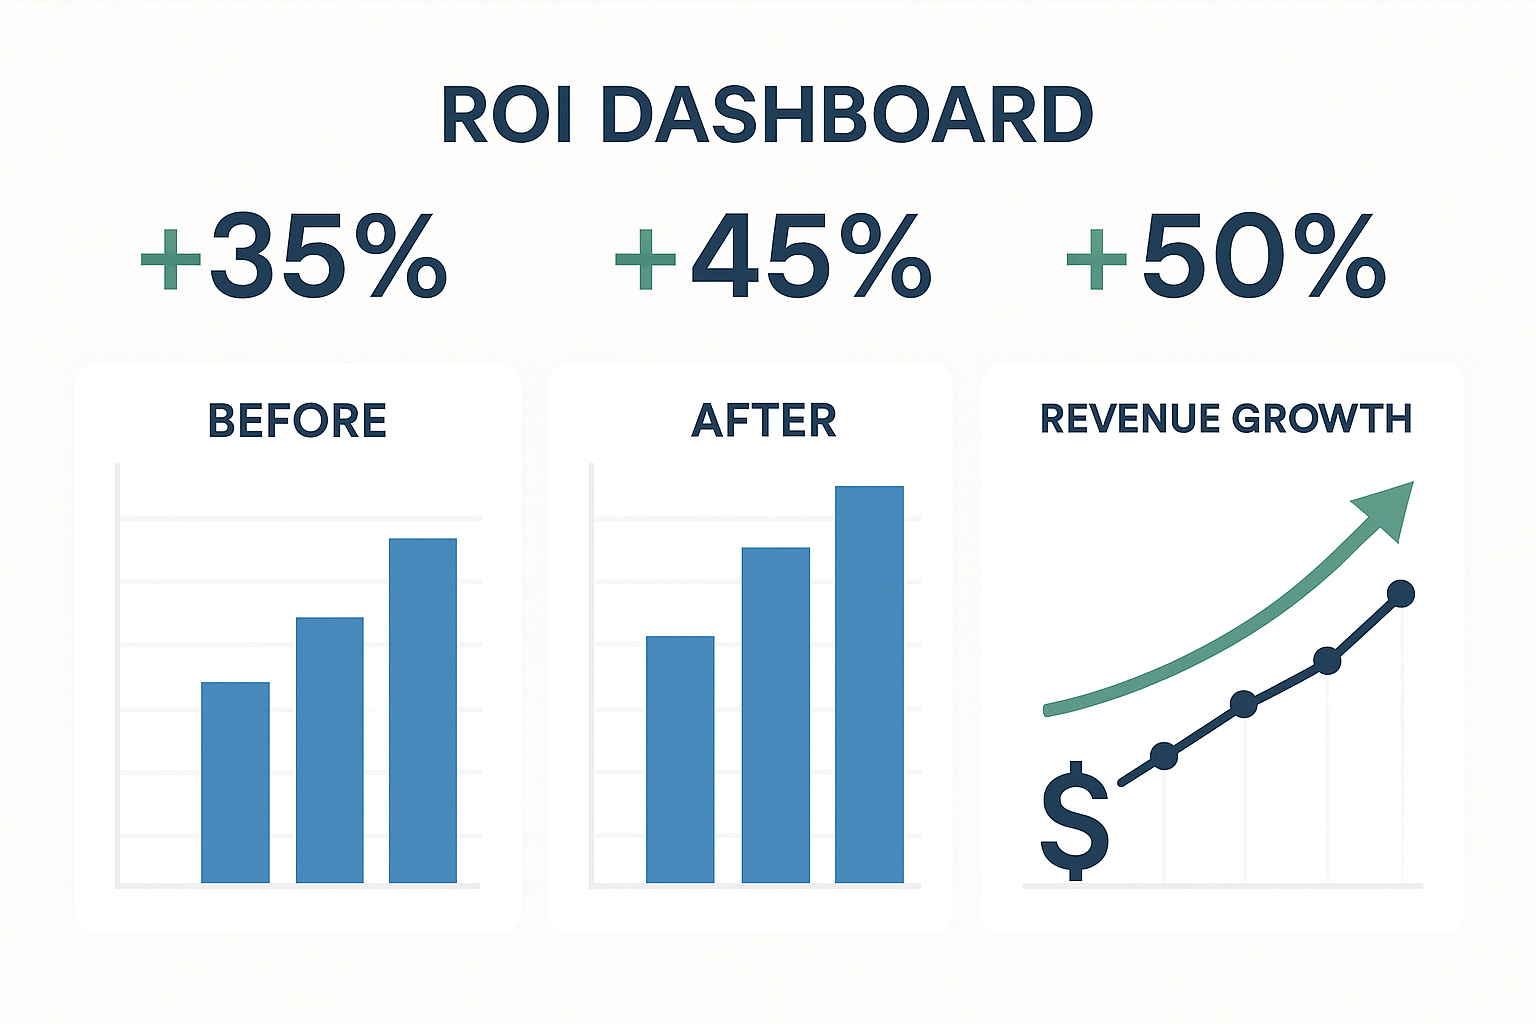
A compelling dashboard visualization showing the business impact and ROI improvements from RFM analysis implementation, featuring before/after comparisons and key performance metrics. Excellent for demonstrating business value.
These images are strategically designed to support different sections of your RFM analysis blog, from conceptual explanations to technical implementation and business results. Each image maintains a professional aesthetic suitable for iTechGenAI's technical content while being visually engaging for readers.


Comments
Post a Comment